Top 5 Bioreactors 2025 Comparison
Precision, analysis speed, automation & compliance: choose the right R&D or pilot bioreactor.
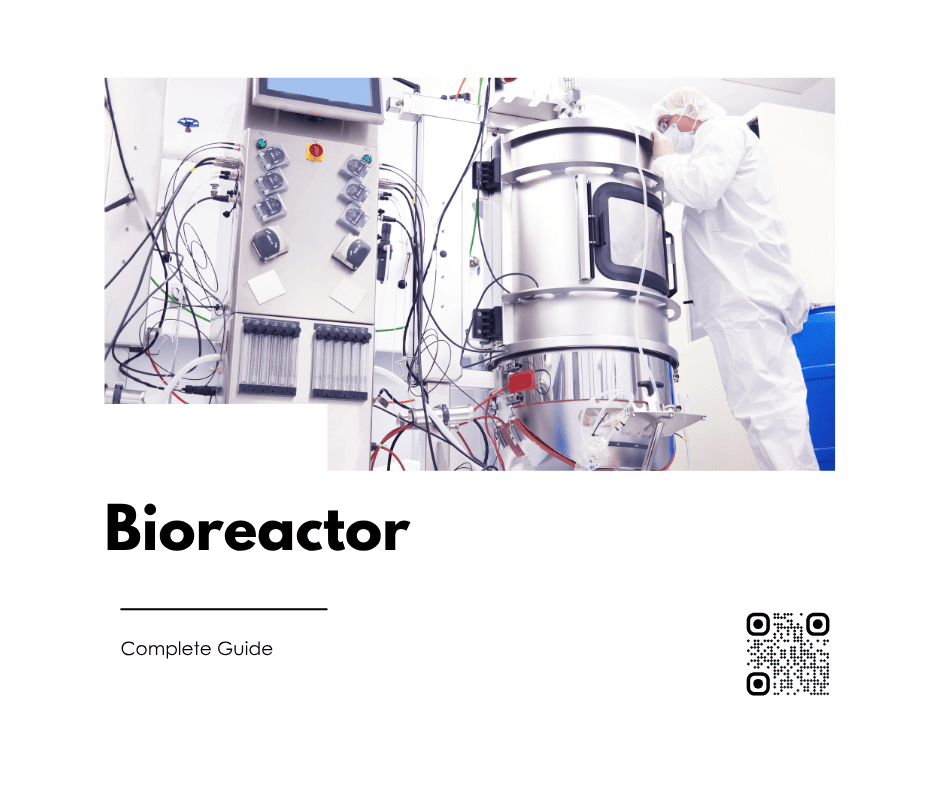
Download PDFIntroduction
Bioreactors underpin biotech processes by ensuring precise pH and temperature control, optimized analysis speed, and scalable harvest. This guide compares five leading platforms in 2025 to help you make the best R&D, QA/QC or pilot choice.
Precision and detection limit
Real-time analysis speed
Automation and LIMS integration
21 CFR Part 11 & GxP compliance
1. Key Technologies
pH/Temp Control
Ensures tight control of culture conditions to maximize yield and product quality by compensating for drift and external disturbances.
pH Precision: ± 0.01 pH
Temp Precision: ± 0.1 °C
Sampling Rate
High-frequency sampling (0.1–1 Hz) captures process dynamics and early anomalies, critical for fast microbial fermentations.
Frequency: 0.1–1 Hz depending on sensor
Online Data: Real-time traceability
Automation & API
Enables scripting, LIMS integration, and remote monitoring for streamlined workflows and full audit trails.
Scripts: Python / REST API
LIMS Integration: Scheduling & audit trails
Regulatory Compliance
Meets industry standards (21 CFR Part 11, GxP) with built-in electronic records, signatures, and validation protocols.
21 CFR Part 11: Electronic records & signatures
GxP/GMP: Process validation
2. Top 5 Bioreactors 2025
| Model | Volume (L) | pH Precision | Sampling Rate (Hz) | Automation | Price (€) |
|---|---|---|---|---|---|
BIOSTAT STR 50 (Sartorius) | 5–50 | ± 0.01 | 1.0 | Plug-and-play modules | 120,000 € |
BIOSTAT B-DCU (Eppendorf) | 0.5–20 | ± 0.02 | 0.5 | Integrated peristaltic pump | 85,000 € |
ez-Control 5 L (Applikon) | 0.1–5 | ± 0.01 | 0.2 | EasyLoad reagent system | 60,000 € |
HyPerforma 1 L (Thermo) | 0.1–2 | ± 0.03 | 0.1 | REST API / Python | 55,000 € |
Allegro SP (Pall) | 10–200 | ± 0.05 | 0.5 | Inline TFF, CIP/SIP | 200,000 € |
3. Detailed Sheets
Performance
Up to 1 Hz sampling, auto nutrient dosing.
Pros
Highly modular, 21 CFR Part 11 compliant.
Cons
High capex.
Best For
R&D and pharma QA/QC.
Performance
0.05 g/L biomass detection limit.
Pros
Touch UI, mid-range budget.
Cons
20 L max, slightly lower pH precision.
Best For
Start-ups & academia.
Performance
Metabolite detection down to 10⁻⁶ g/L.
Pros
Quick install, moderate cost.
Cons
Max scale 5 L.
Best For
Benchtop R&D.
Performance
Full LIMS integration, multi-param alerts.
Pros
Excellent price/performance.
Cons
Requires software ramp-up.
Best For
Automated workflows.
Performance
Inline separation, scale-up to 200 L.
Pros
Robust GMP, CIP/SIP.
Cons
Very high cost.
Best For
Pilot production.
4. Recommendations
5. FAQ
This spec is measured at 25 °C with certified buffers. In 37 °C bioreactions, expect ±0.02–0.03 due to mixing dynamics. Recalibrate every 24 h and check offset drift daily.
Sampling at 1 Hz can cause micro‐aspiration stress on delicate cell lines. For sensitive mammalian or primary cells, limit to 0.2–0.5 Hz or use a microfluidic bypass loop.
**Automated** CIP/SIP reduces downtime by ~75 % and minimizes human error—recommended for GMP environments. **Manual** cleaning is cost-effective for ≤10 L systems but requires strict SOPs and LIMS‐tracked logs.
**CAPEX**: purchase + installation (~10 %). **OPEX**: consumables (sensors, reagents), maintenance, labor. **Productivity gains**: factor in hours saved via automation and reduction in retests due to higher accuracy.
**IQ/OQ**: validate installation, alarms, UI. **PQ**: run a water-only or standard culture batch, compare pH/Temp/DO vs. external meters. Archive protocols, results, and 21 CFR Part 11–compliant signatures.
**< 5 L**: benchtop R&D screening. **5–50 L**: pilot‐scale formulation & stability. **50–200 L**: pre-clinical pilot production.
Monitor optical density and metabolite concentrations in real time. Ensure the optical pathlength and cleaning protocol support your assay sensitivity.
**MTBF** (Mean Time Between Failures) ≥ 1000 h for probes. **MTTR** (Mean Time To Repair) < 2 h. **Drift rate** < 0.05 pH/day.
Choose systems with **REST API** or **OPC UA**. Example Python snippet: ```python import requests data = requests.get('http://bioreactor.local/api/data?since=24h').json() # Push to LIMS… ```
pH/Temp deviation vs. setpoint (σ < ±0.05), DO levels, CO₂ evolution, sterility & endotoxin QC results.
6. Maintenance & Reliability
- MTBF (Mean Time Between Failures): ≥ 1000 h for pH/Temp probes
- MTTR (Mean Time To Repair): < 2 h with on-site parts
- Calibration Frequency: Every 24 h or per batch start
- pH Drift Rate: < 0.05 pH/day
7. Case Studies
Academic Lab X: 30 % faster pH monitoring
By replacing analog probes with inline digital sensors and automating sampling, Lab X reduced cycle time by 30 % and eliminated data logging errors.
- • 30 % reduction in cycle time
- • 50 % fewer retests
Biotech Startup Y: ROI in 8 months
Startup Y integrated auto-dosing modules and remote alerts, achieving ROI in 8 months through productivity gains and reduced downtime.
- • 8 months to ROI
- • 75 % decrease in manual interventions
8. Bonus Features
Advanced analytics dashboard
Adaptive PID control
Remote monitoring & alerts
Modular expansion kits
Automated cleaning & CIP/SIP
9. Multilingual Glossary
| Analysis speed | Vitesse d’analyse | Analysegeschwindigkeit | Velocità di analisi |
| Detection limit | Limite de détection | Nachweisgrenze | Limite di rilevazione |
| Sampling rate | Taux d’échantillonnage | Probenahmerate | Frequenza di campionamento |
| Harvest scale | Échelle de récolte | Erntemaßstab | Scala di raccolta |
| 21 CFR Part 11 compliance | Conformité 21 CFR Part 11 | 21 CFR Part 11 Konformität | Conformità 21 CFR Part 11 |
10. Conclusion
Each bioreactor balances precision, automation, and budget. Evaluate your real needs, TCO, and compliance to maximize ROI.
Contact our team for a personalized demo and tailored support.
Contact Us